Global Antimony Trioxide Prices Outlook – Q3 2026
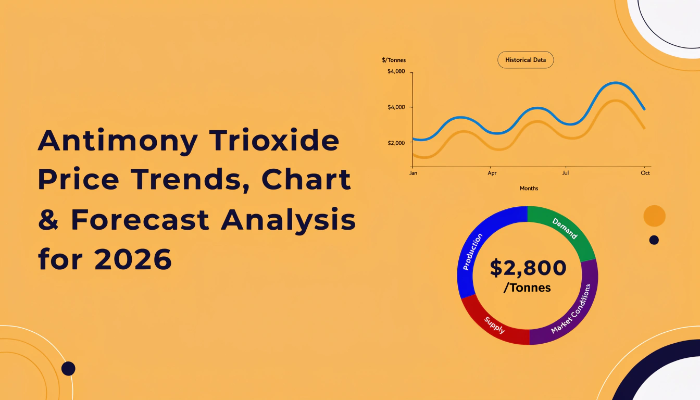
Antimony Trioxide Price Trend 2026 requires close monitoring as buyers assess regional price differences, raw material availability, and downstream industrial demand. During Q3 2026, reported prices varied significantly across the five monitored markets, with the UK recording the highest price at USD 56,126/MT and China the lowest at USD 35,488/MT. However, the overall quarterly direction and percentage change cannot be verified without comparable Q2 2026 data.
According to IMARC Group’s Q3 2026 price-tracking database and pricing methodology, regional benchmarks provide a useful basis for evaluating procurement costs and supplier competitiveness. Buyers can also use the Antimony Trioxide Price Forecast to assess potential purchasing risks and plan sourcing strategies. The observed price spread highlights the importance of comparing regional quotations alongside freight expenses, product specifications, and delivery terms before negotiating supply contracts.
Antimony Trioxide Prices Q3 2026: Regional Price Snapshot
The reported Q3 2026 prices across the five monitored markets are:
- USA: USD 43,958/MT
- China: USD 35,488/MT
- Netherlands: USD 39,511/MT
- UK: USD 56,126/MT
- Japan: USD 48,550/MT
What Do Regional Antimony Trioxide Prices Indicate in Q3 2026?
The regional price spread indicates substantial differences in reported procurement benchmarks. The UK recorded the highest price, followed by Japan and the USA, while the Netherlands remained below the US benchmark. China reported the lowest price among the five markets. This variation may reflect differences in supply availability, import dependence, logistics, product specifications, and local purchasing conditions. However, the available figures alone do not establish the causes of these gaps or confirm changes in regional demand. Buyers should compare equivalent grades, delivery terms, and taxes before treating the differences as potential sourcing savings.
Antimony Trioxide Price Analysis by Country: Q3 2026
North America: USA Antimony Trioxide Price
The reported US price stood at USD 43,958/MT in Q3 2026. This benchmark provides a reference for buyers in flame-retardant applications, plastics, and related industrial supply chains. Domestic inventory imported material availability, and transportation costs can influence purchasing conditions. Without comparable quarterly data, the direction of the US price movement remains unverified.
Asia-Pacific: China and Japan Antimony Trioxide Prices
China recorded USD 35,488/MT, the lowest of the five reported benchmarks, while Japan stood at USD 48,550/MT. Differences in local production, export availability, import requirements, and distribution costs may contribute to this gap. Nevertheless, the figures do not independently confirm stronger demand or tighter supply in either country. Buyers should evaluate supplier quotations and material specifications before making regional comparisons.
Europe: Netherlands and UK Antimony Trioxide Prices
The Netherlands recorded USD 39,511/MT, compared with USD 56,126/MT in the UK. The difference may reflect distinct procurement channels, supplier contracts, logistics, and local market conditions. Both figures are useful reference points for European buyers, but comparable historical prices and consistent delivery terms are needed to establish the direction of change.
Antimony Trioxide Supply and Demand Overview: Q3 2026
Antimony trioxide supply conditions depend on upstream antimony availability, processing capacity, inventory levels, and international trade. Changes in mining output or restrictions affecting the movement of antimony-bearing materials can influence production costs and supplier availability.
Demand is linked to several industrial applications, particularly flame-retardant systems used in plastics, rubber, textiles, electrical components, and building materials. Other applications include selected glass, ceramic, and specialty chemical processes.
When buyers face longer delivery times or limited supplier choices, procurement costs may become more sensitive to changes in raw material prices. Conversely, adequate inventories and competing offers can improve purchasing flexibility.
The available Q3 2026 country prices do not establish a global supply deficit or surplus. Assessing the balance requires additional evidence, including production volumes, shipment data, inventory movements, and downstream order activity.
Antimony Trioxide Price Trend and Historical Index Analysis
Antimony Trioxide Price Trend: What Does the Quarterly Index Show?
The Antimony Trioxide Price Trend should be evaluated using comparable quarterly benchmarks, rather than isolated country prices. The Q3 2026 observations establish the current reported price levels across five markets, but they do not provide the percentage change from Q2.
A reliable quarterly index comparison requires consistent product grades, geographic coverage, currency, and pricing terms. Once these variables are aligned, buyers can determine whether prices increased, decreased, or remained stable and identify which regions contributed most to the movement.
Antimony Trioxide Price Chart: How Can Buyers Track Historical Changes?
An Antimony Trioxide Price Chart helps procurement teams identify turning points, recurring fluctuations, and differences between regional benchmarks. Historical observations should be plotted alongside the corresponding quarterly index and relevant raw material indicators.
For a meaningful Q2-to-Q3 comparison, buyers should obtain the previous quarter’s prices and calculate the percentage movement for each country. Without those historical observations, assigning a numerical index change or declaring a confirmed quarterly uptrend or downtrend would be misleading.
Antimony Trioxide Price Forecast 2026: What Should Buyers Expect?
Over the next 12 months, antimony trioxide prices will depend on upstream raw material availability, processing costs, industrial demand, trade conditions, and supplier inventories. The five Q3 benchmarks provide a starting point for procurement planning, but they are insufficient to support a specific numerical forecast.
Buyers should monitor three possible developments:
- Upward pressure: Reduced raw material availability, higher production costs, or logistics disruptions could increase supplier quotations.
- Downward pressure: Improved availability, greater competition, or weaker downstream orders could ease purchasing costs.
- Price stability: Balanced supply and demand, combined with steady freight rates, could limit short-term fluctuations.
Procurement teams should maintain alternative suppliers, review contract pricing clauses, and compare spot purchases with longer-term agreements. Forecasts should be updated when verified production, trade, and historical pricing data become available.
Key Factors Affecting Antimony Trioxide Prices: Quarterly Perspective
Several factors can influence the price of antimony trioxide and its regional availability.
- Raw material costs: Antimony feedstock availability and processing expenses directly affect production economics.
- Energy costs: Electricity and fuel expenses can influence processing, refining, and transportation costs.
- Industrial demand: Changes in orders from flame-retardant, plastics, rubber, and other end-use industries can affect supplier pricing.
- Freight and logistics: Shipping rates, insurance, delivery times, and port disruptions can change the landed cost of imported material.
- Trade restrictions: Export controls, customs requirements, and changes in trade flows may affect market access.
- Inventory and contracts: Supplier stocks, purchasing commitments, and the balance between spot and contracted volumes can influence quotation levels.
These factors should be assessed against verified quarterly data before attributing a specific price movement to any single cause.
What Is Antimony Trioxide and Where Is It Used?
Antimony trioxide is an inorganic compound of antimony and oxygen, commonly represented by the chemical formula Sb₂O₃. It is an important industrial material used primarily as a synergist in halogenated flame-retardant systems, helping improve their fire-retardant performance.
Its applications include plastics, rubber, textiles, electrical and electronic components, and selected construction materials. It is also used in certain glass, ceramic, and specialty manufacturing processes.
Because it serves several industrial supply chains, demand depends on manufacturing activity, formulation requirements, applicable safety standards, and the availability of alternative materials. Buyers should assess technical specifications, purity, particle characteristics, and regulatory requirements when comparing suppliers.
Antimony Trioxide Market Developments: Q3 2026 Highlights
The Q3 2026 regional benchmarks show a wide spread between the lowest reported price in China and the highest in the UK. This difference is relevant to sourcing decisions, although it does not independently confirm a change in global trade flows or supplier capacity.
No independently verified Q3 2026 announcements on specific capacity expansions, production cuts, or major supplier developments are available in the supplied pricing dataset. Therefore, these events should not be presented as confirmed drivers of the quarter’s prices.
For a fuller assessment, buyers should track mining and processing announcements, export policy changes, shipment volumes, producer operating rates, and updates from established suppliers. Combining these indicators with historical prices can help distinguish temporary regional differences from broader supply-demand changes.
Frequently Asked Questions About Antimony Trioxide Prices
What Was the Antimony Trioxide Price Trend in Q3 2026?
Reported prices ranged from USD 35,488/MT in China to USD 56,126/MT in the UK. The overall quarterly direction cannot be confirmed without comparable Q2 2026 prices.
Where Can I Find an Antimony Trioxide Price Chart?
An Antimony Trioxide Price Chart and related pricing information can be accessed through IMARC Group’s Antimony Trioxide Price Trend report. Historical comparisons should use consistent regional benchmarks and quarterly observations.
What Factors Will Affect Antimony Trioxide Prices in 2026?
Prices may respond to raw material availability, processing and energy costs, industrial demand, freight rates, trade restrictions, and supplier inventories. The direction and scale of future changes will depend on how these factors evolve.
How IMARC Group Helps Businesses Track Antimony Trioxide Prices
IMARC Group provides pricing intelligence to support procurement planning, supplier comparisons, and commodity cost assessments. Its regional price benchmarks help businesses evaluate differences across key sourcing markets. Historical pricing data can support trend analysis and purchasing decisions when comparable quarterly observations are available. Buyers can also monitor relevant supply-demand indicators to assess procurement risks. Over the next 12 months, combining updated price benchmarks with verified trade and production information can improve sourcing decisions and help businesses prepare for potential cost fluctuations.
Browse More Related Reports:
- EPDM Rubber Price Trend Analysis: https://www.imarcgroup.com/epdm-rubber-pricing-report
- Polystyrene Price Trend Analysis: https://www.imarcgroup.com/polystyrene-pricing-report
Contact Us:
IMARC Group
134 N 4th St., Brooklyn, NY 11249, USA
Email: sales[@]imarcgroup.com
Tel No:(D) +91 120 433 0800
United States: +1-201971-6302