The global Steel Price Index showed a mixed but slightly upward movement during Q1 2026, reflecting a moderate recovery across key regions. The steel price chart indicated a gradual increase of around 3–5% compared to Q4 2025, supported by improved industrial activity and steady demand from infrastructure projects.
In terms of pricing, the USA recorded approximately USD 889/MT, while Germany stood at USD 797/MT. In Asia, Malaysia reported lower levels at USD 561/MT, indicating regional cost advantages. Canada and Brazil followed closely at USD 880/MT and USD 801/MT respectively. This variation highlights regional cost dynamics and supply conditions influencing global pricing.
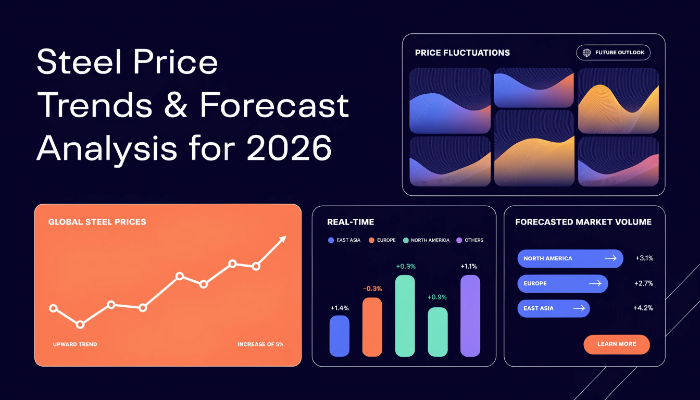
Steel Price Chart Analysis Q1 2026
A close look at the Steel Price Chart for Q1 2026 shows a steady upward trajectory throughout the quarter. Prices began slightly lower in January, gained momentum in February, and reached peak levels in March.
The lowest point of the quarter was observed in early January due to slower post-holiday demand. However, as industrial activity resumed, prices increased consistently. Compared to Q4 2025, where prices remained relatively stable, Q1 2026 demonstrated a more pronounced upward trend, indicating improved market confidence.
The overall movement suggests controlled growth rather than volatility, making the trend easier to predict and analyze for procurement planning.
Steel Price Trend Q1 2026: Global Overview
The Steel price trend during Q1 2026 was shaped by multiple cost and demand-side factors. Rising energy costs and feedstock prices contributed to gradual increases, while steady demand from construction and automotive sectors supported price stability.
Fluctuations in crude oil prices indirectly impacted production costs, especially in regions dependent on imported energy. Additionally, supply chain improvements compared to previous quarters helped reduce delays, allowing smoother distribution.
Overall, the trend remained moderately bullish, with stable growth rather than sharp spikes.
Regional Price Analysis
North America
North America experienced relatively firm pricing during Q1 2026. The USA and Canada maintained high price levels due to strong domestic demand and consistent infrastructure spending. Limited imports and stable production also supported pricing.
Europe
In Europe, Germany’s pricing reflected moderate stability. Energy costs remained a key factor, but improved industrial output helped maintain steady demand. Pricing fluctuations were minimal, indicating a balanced supply-demand situation.
Asia-Pacific
Asia-Pacific showed the most variation, with Malaysia recording the lowest prices among major regions. Lower production costs and competitive exports contributed to this trend. However, demand growth remained moderate, keeping price increases controlled.
Regional Price Snapshot (Q1 2026)
- USA — USD 889/MT
- Germany — USD 797/MT
- Malaysia — USD 561/MT
- Canada — USD 880/MT
- Brazil — USD 801/MT
These prices reflect regional production costs, demand levels, and trade dynamics. North America remained at the higher end due to strong consumption, while Asia-Pacific offered more competitive pricing. Europe maintained a balanced position with stable industrial demand. Overall, the global pricing landscape showed moderate variation with no extreme volatility.
Key Market Drivers
- Rising energy and fuel costs impacting production expenses
- Stable demand from construction and infrastructure sectors
- Moderate growth in automotive and manufacturing industries
- Improved supply chain efficiency compared to previous quarters
- Regional production differences influencing price gaps
- Trade policies and import-export dynamics affecting availability
Steel Price Forecast 2026
Looking ahead, the Steel price forecast 2026 suggests a stable to slightly upward trend. Prices are expected to remain supported by ongoing infrastructure investments and steady industrial growth.
However, fluctuations in energy costs and global economic conditions may introduce short-term variations. The second half of 2026 could see stronger price movements if demand accelerates further.
Overall, the outlook remains cautiously optimistic with gradual growth expected.
Steel Price Index & Historical Comparison
The Steel Price Index provides a benchmark to track price movements over time. When compared to previous years, Q1 2026 prices indicate a recovery phase following earlier fluctuations.
The steel price history chart shows that prices have stabilized after periods of volatility seen in prior years. This stabilization reflects improved supply conditions and balanced demand across regions.
Historical comparison also highlights that current prices are within a moderate range, making them more predictable for long-term planning.
Impact on Related Markets
Steel pricing directly affects several related industries. Construction costs are influenced by material price changes, while automotive manufacturing depends on stable steel supply for production planning.
Additionally, machinery and equipment sectors experience cost variations based on steel input prices. Packaging and infrastructure projects also face budget adjustments due to changes in material costs.
Overall, stable pricing helps maintain cost predictability across these industries.
FAQs About Steel Price Trends Analysis & Market Insights:
What is the Steel Price Index and why is it important?
The Steel Price Index measures the average price movement of steel over time. It helps businesses track trends, plan procurement, and understand cost fluctuations across regions.
How does the Steel Price Chart help in analysis?
The Steel Price Chart provides a visual representation of price changes over a period. It helps identify trends, peak pricing points, and seasonal patterns for better decision-making.
What is the Steel price forecast 2026?
The Steel price forecast 2026 indicates a stable to slightly increasing trend, supported by steady demand and controlled supply conditions, with possible short-term fluctuations.
Stay Ahead with Latest Price Trends – Grab Your Sample Today:
Conclusion
Q1 2026 reflected a stable and gradually improving pricing environment for steel. The Steel Price Index showed moderate growth, supported by consistent demand and improved supply chains. Regional variations remained evident, with North America leading in pricing levels.
Looking ahead, prices are expected to follow a steady path with limited volatility. As highlighted by IMARC Group, long-term trends suggest balanced growth, making the outlook favorable for industries relying on steel.
Contact Us:
IMARC Group
134 N 4th St., Brooklyn, NY 11249, USA
Email: sales[@]imarcgroup.com
Tel No:(D) +91 120 433 0800
United States: +1-201971-6302